Home
About
Blog
GitHub
Twitter
LinkedIn
Google Scholar
Blog
Categories
All
(2)
code
(2)
dataviz
(2)
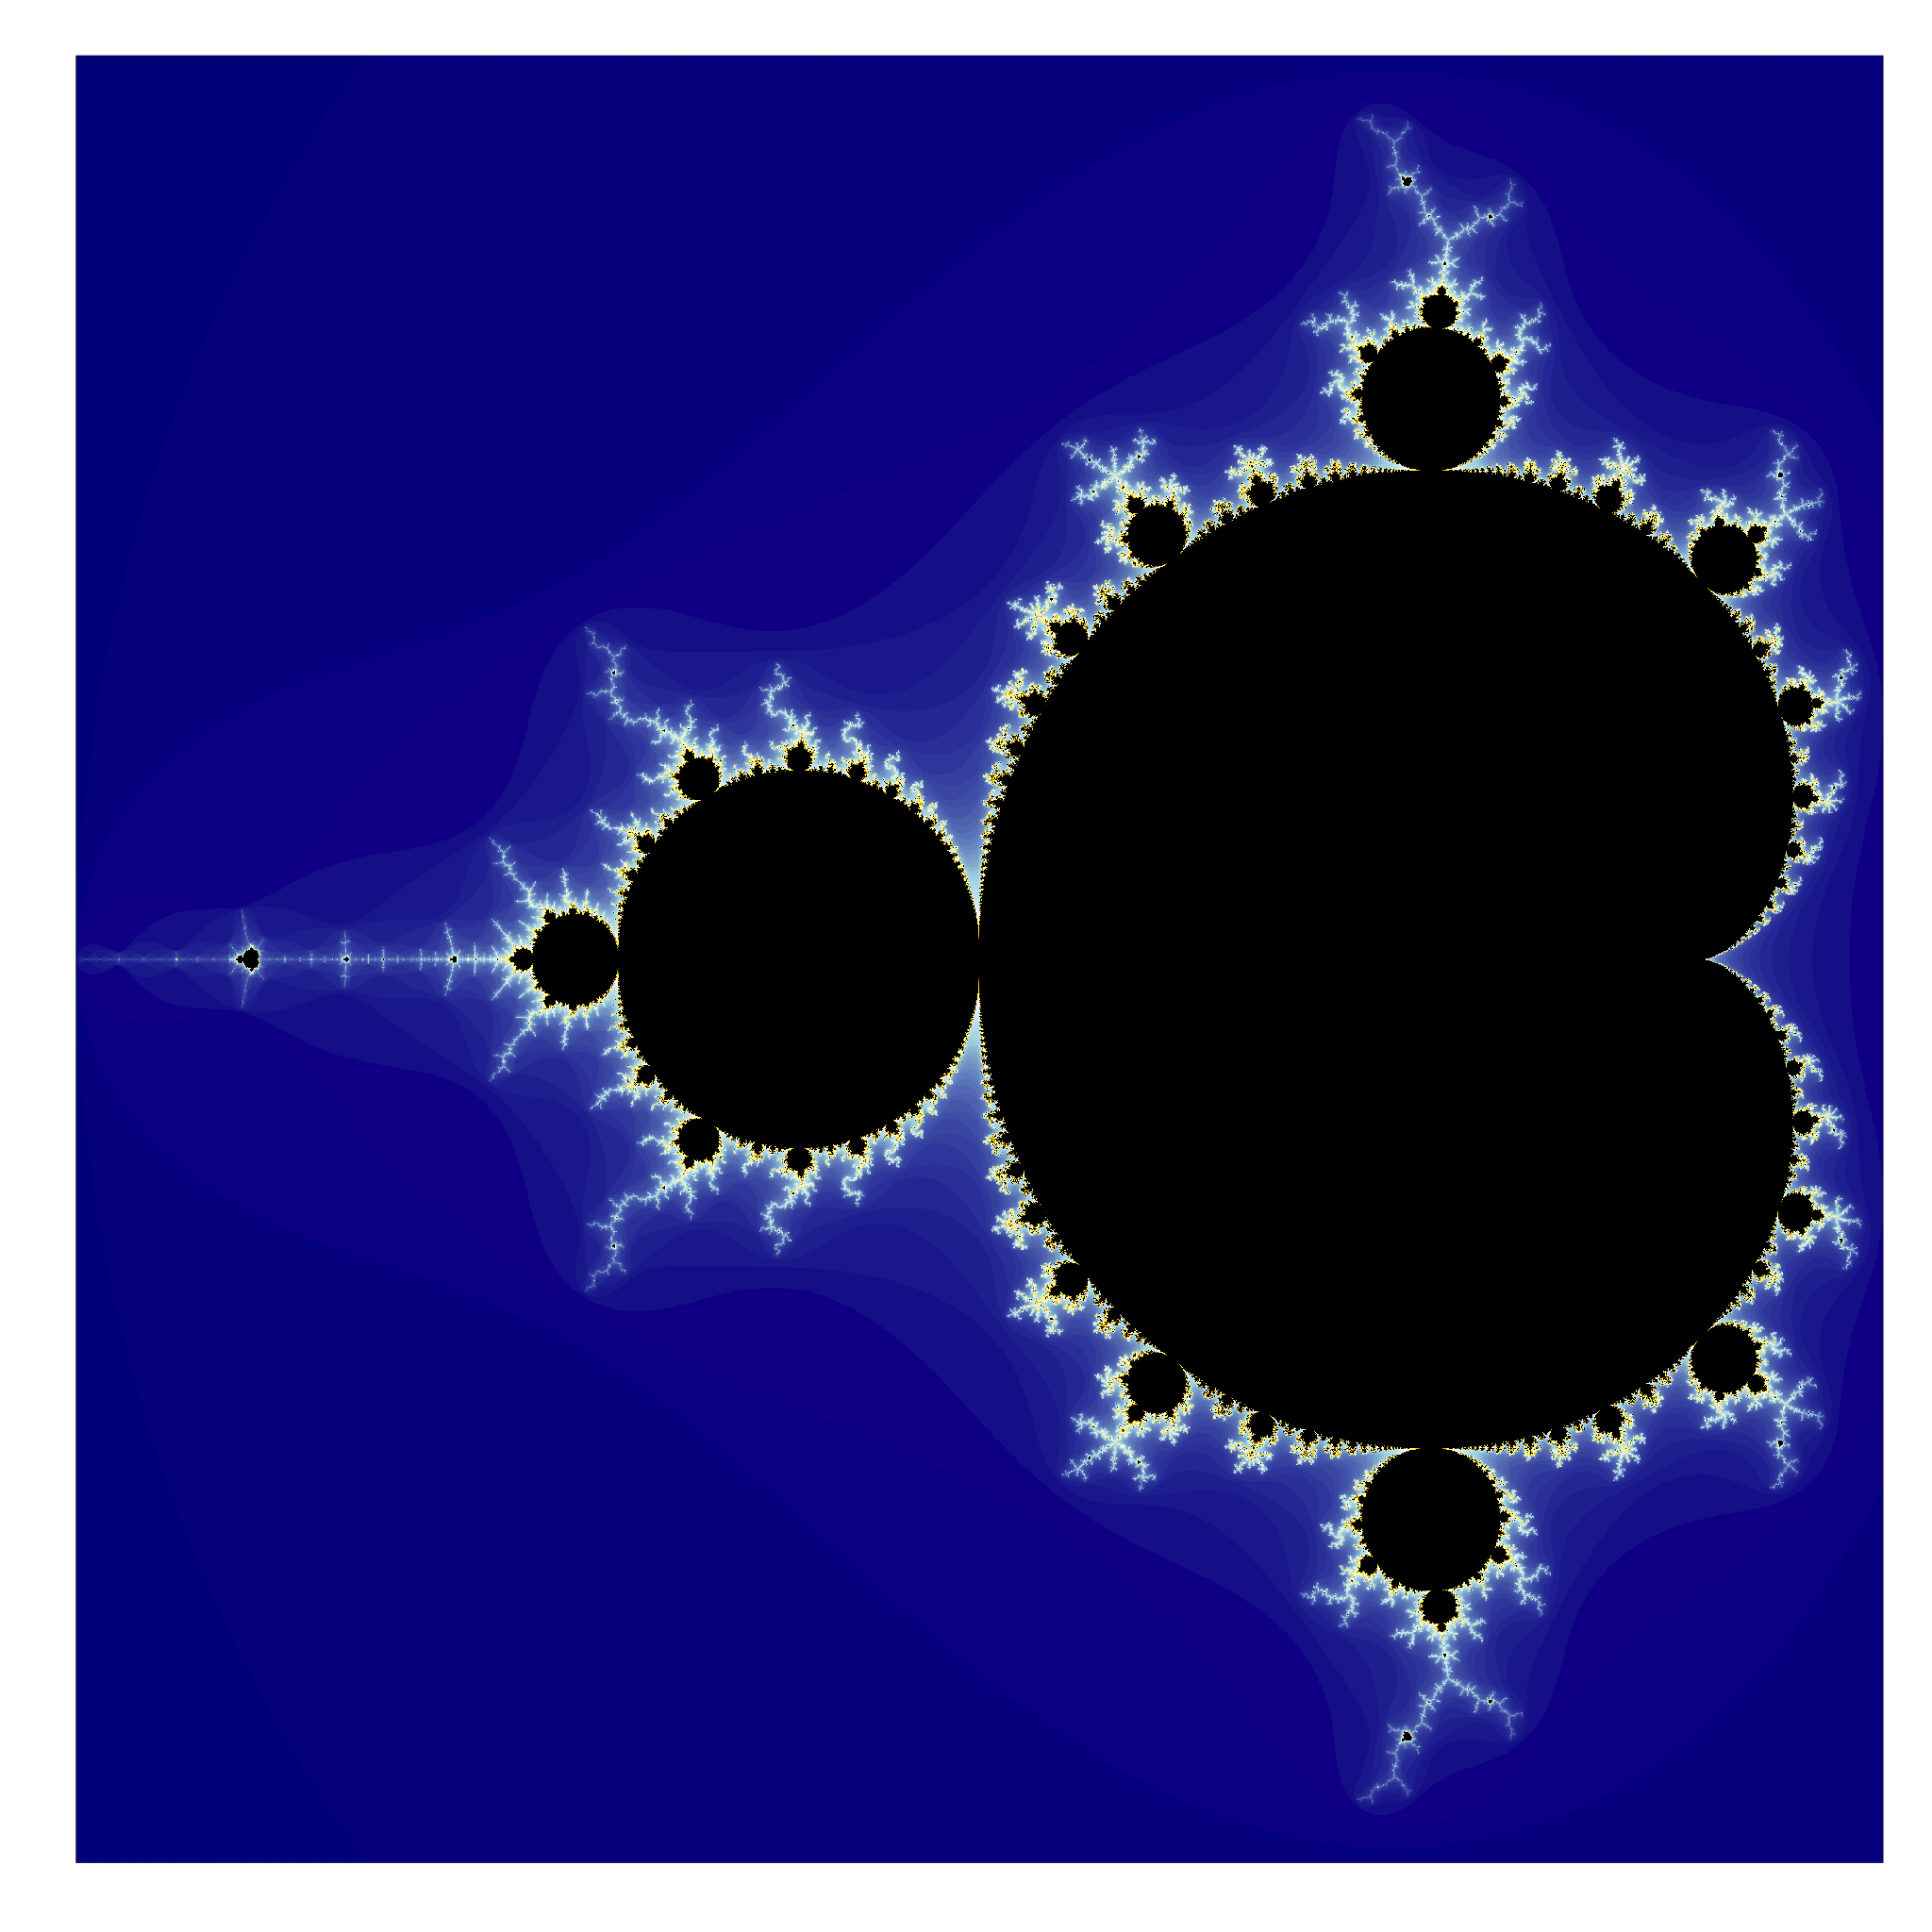
Visualising the Mandelbrot set in R
code
dataviz
In this brief post, we will take a look at how we can visualise the Mandelbrot set using recursion in
R
. The set looks like this (click the image to enlarge):
Aug 3, 2022
Leon Eyrich Jessen
Data Science meets music
code
dataviz
In this brief post, we will take a look at what happens if we mix data science and music… Should be good… For this post to make sense, you’ll need to know a bit of musical theory and a bit of data science - Enjoy!
Aug 3, 2022
Leon Eyrich Jessen
No matching items