Mandelbrot_count <- function(c, z = complex(r = 0, i = 0), n = 0, lim = lim){
  n <- n + 1
  z <- z * z + c
  if( abs(z) > 2 | n > lim ){
    return(n)
  }
  # Recurse until return criteria are met
  Mandelbrot_count(c = c, z = z, n = n, lim = lim)
}Introduction
In this brief post, we will take a look at how we can visualise the Mandelbrot set using recursion in R. The set looks like this (click the image to enlarge):
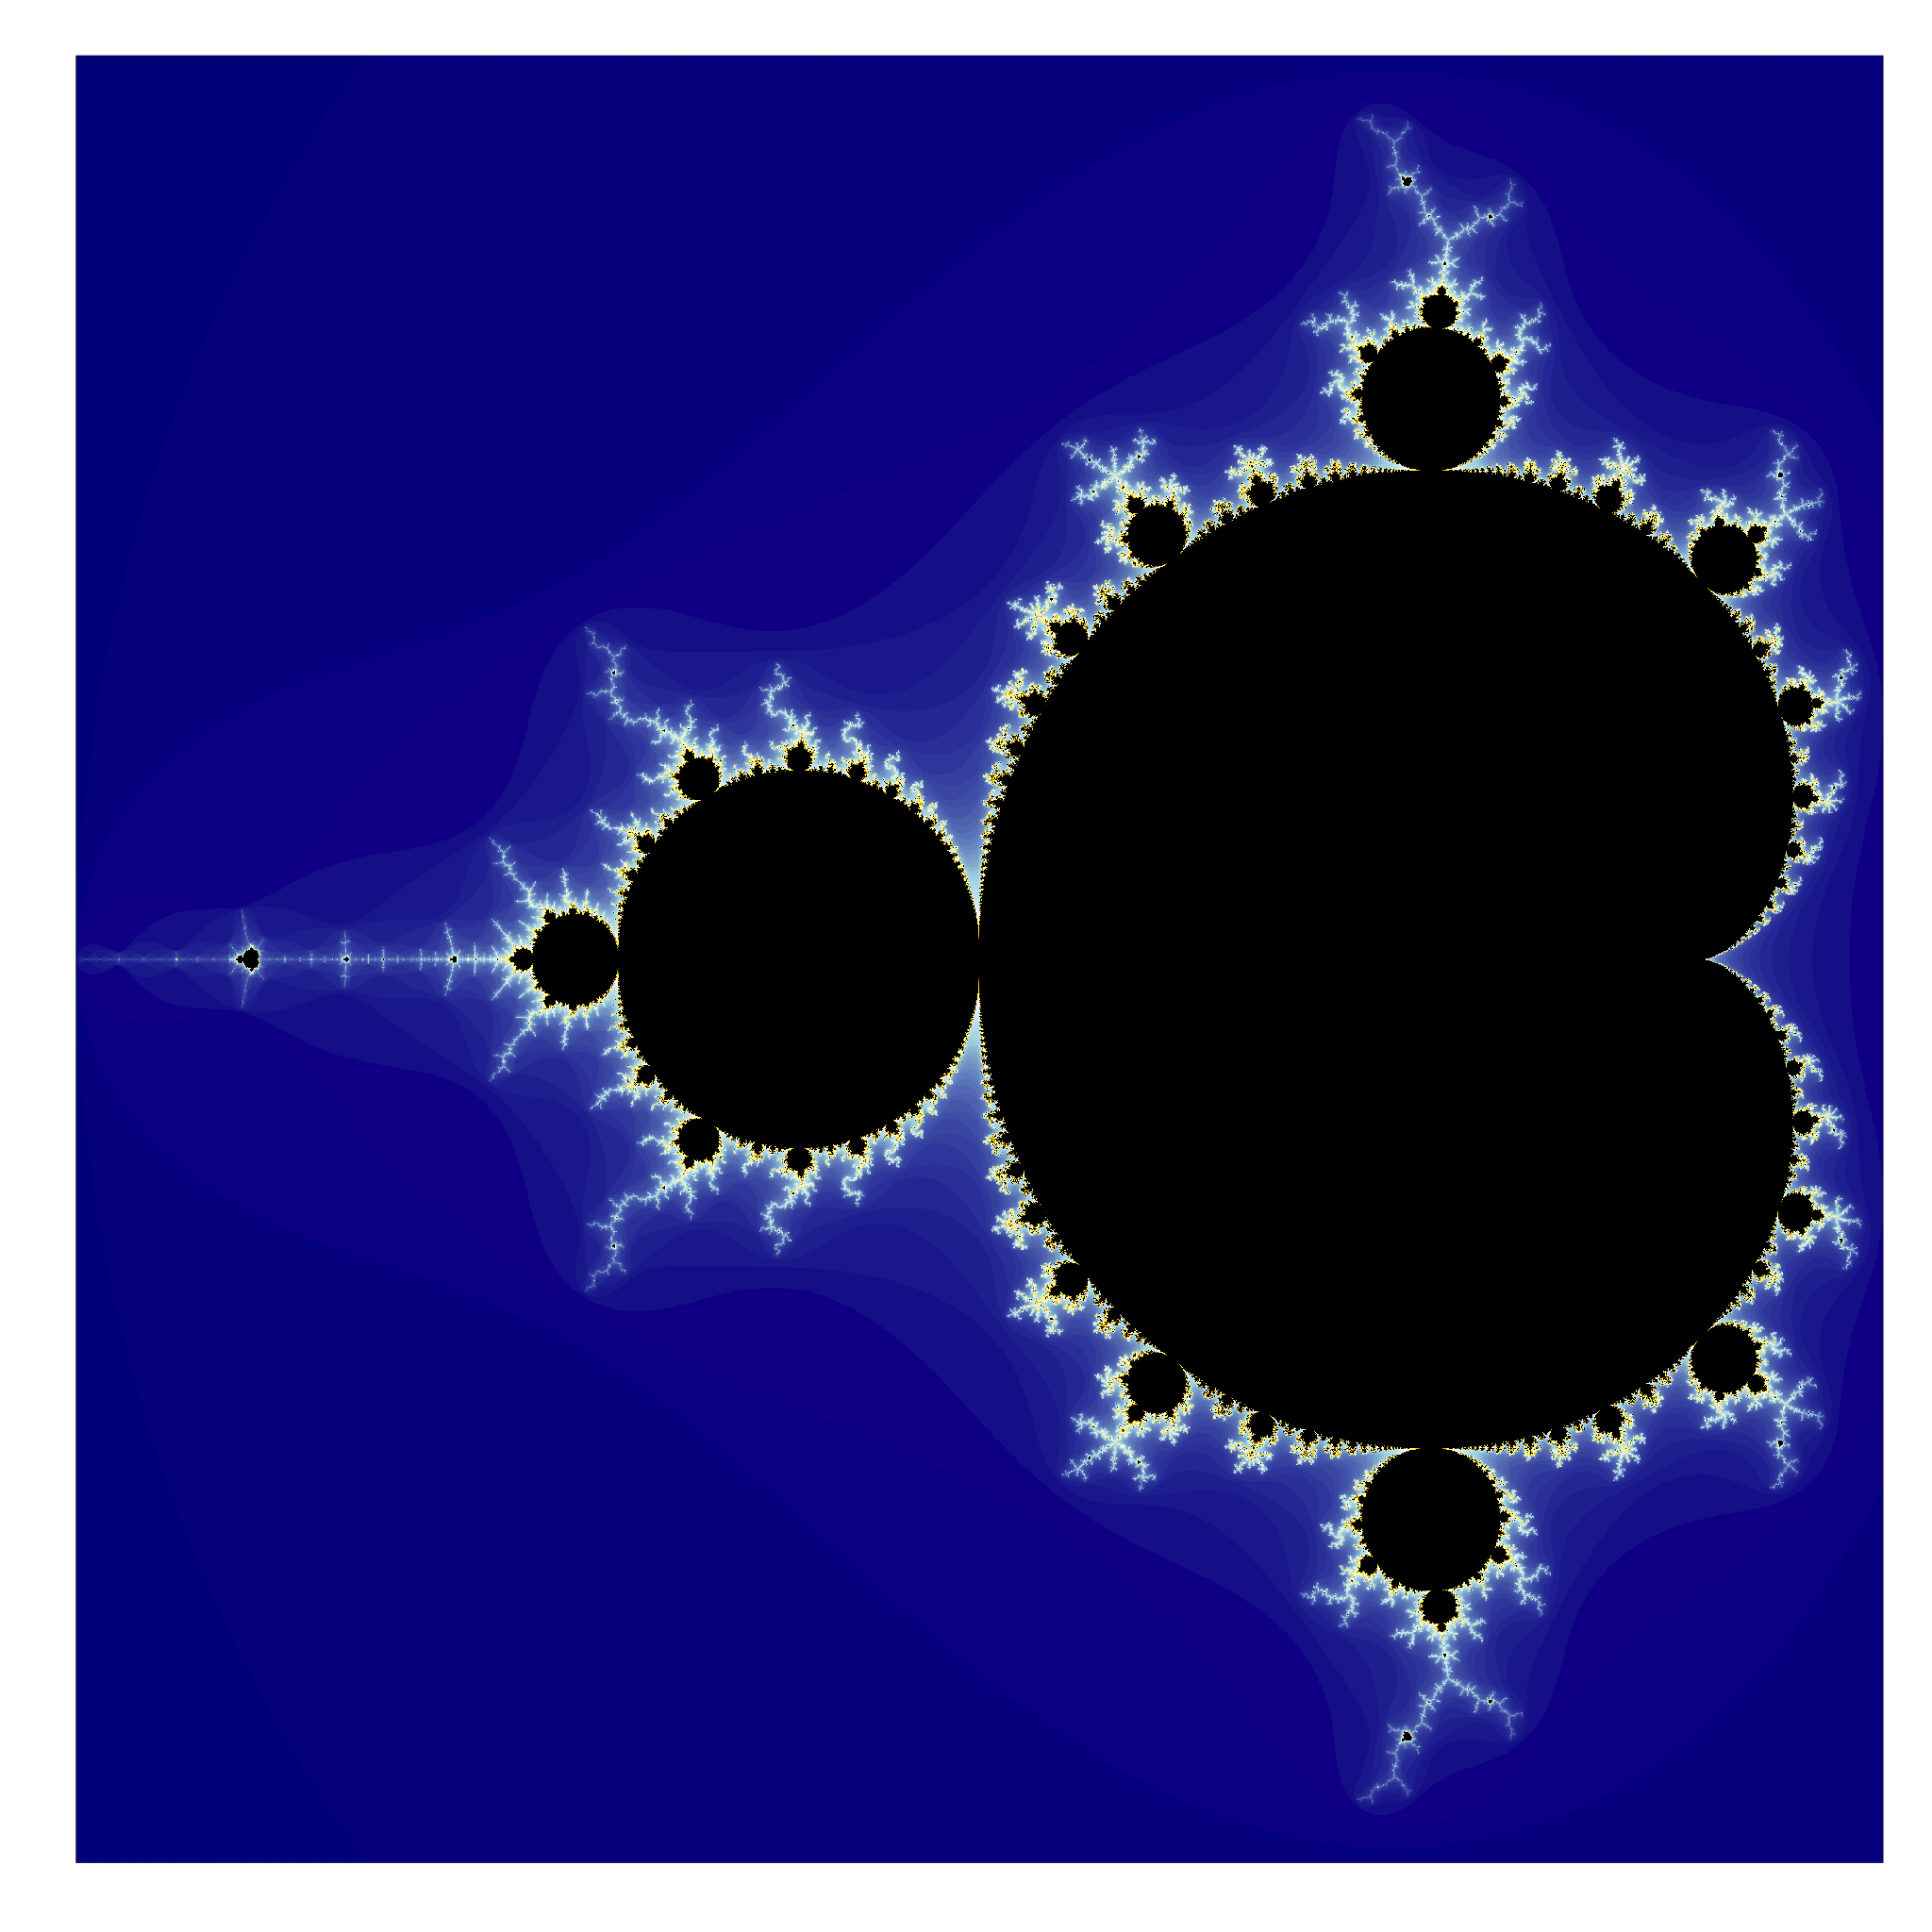
This post was inspired by this excellent Numberphile video featuring Dr. Holly Krieger. Below, we will go over the code, but skip the mathematics, as these are covered in the video.
Functions
Each pixel in the final image is a count, so we need to create a function, which computes the count for a given input c, not how we are using recursion to solve the problem:
Next, we need to create a function, which can compute the pixels of the final visualisation:
Mandelbrot_matrix <- function(res, lim){
  A <- seq(-2, 0.5, len = res)            # Values along the complex a-axis
  B <- seq(-1.2, 1.2, len = res)          # Values along the complex b-axis
  mb <- matrix(0, nrow = res, ncol = res) # Prebuild mandelbrot count matrix

  # Each pixel in the final picture is a count, generate counts
  for( i in 1:res ){
    for( j in 1:res ){
      mb[i,j] <- Mandelbrot_count(c = complex(r = A[i], i = B[j]), lim = lim)
    }
  }

  # Done, return
  return(mb)
}
Computation
Now, we can generate the count matrix of the mandelbrot set:
#  - res [Pixel resolution res x res]
#  - lim [Bail out limit for max number of iterations]
res <- 2048
lim <- 128
mb <- Mandelbrot_matrix(res = res, lim = lim)
Visualisation
Lastly, we can generate the visualisation of the mandelbrot set:
# Set colour palette
palette <- c("darkblue", "lightblue", "white", "yellow", "orange", "black")
colours <- colorRampPalette(palette)(n = lim)

# Plot to png
png_file <- paste0("mandelbrot_png_res_", res, "_lim_", lim, ".png")
png(filename = png_file, width = res, height = res)
par(pty = "s")
image(mb, col = colours, xaxt = "n", yaxt = "n")
dev.off()
Done - That’s the code, which produces the image at the beginning of this post.
Until next time…